Why Analytics are Essential for Your Trade Journal.
Updated: October 7, 2024

Table of Contents
- Introduction to Trade Journals
- Understanding Analytics
- Benefits of Using Analytics in Trade Journals
- Tools and Techniques for Analytics
- Case Studies and Real-Life Examples
Introduction to Trade Journals
A trade journal is a record of your trading activities. It helps you track your trades, strategies, and outcomes. Keeping a trade journal can improve your trading skills. It allows you to learn from your successes and mistakes.
The purpose of a trade journal goes beyond just recording trades. It helps you analyze your performance over time. You can see what works and what doesn't. This reflection can lead to better decision-making in the future.
Analytics play a big role in trade journals. They provide insights into your trading patterns. By using analytics, you can enhance your trading strategies. This means you can make more informed choices based on data.
Understanding Analytics
So, what are analytics? Simply put, analytics is the process of examining data to draw conclusions. In trading, this means looking at numbers and trends to understand your performance.
There are different types of analytics relevant to trading. Descriptive analytics shows what has happened in the past. Predictive analytics helps forecast future trends. Prescriptive analytics suggests actions based on data. Each type can provide valuable insights for traders.
Data is key in decision-making. Without data, you're guessing. With data, you can make informed choices. This can lead to better outcomes in your trades. Analytics can reveal patterns in trading that you might not see otherwise. For example, you might notice that certain trades perform better at specific times. Recognizing these patterns can help you adjust your strategies.
In summary, analytics are essential for your trade journal. They help you understand your trading habits and improve your strategies. By using analytics, you can make smarter decisions and increase your chances of success.
Benefits of Using Analytics in Trade Journals
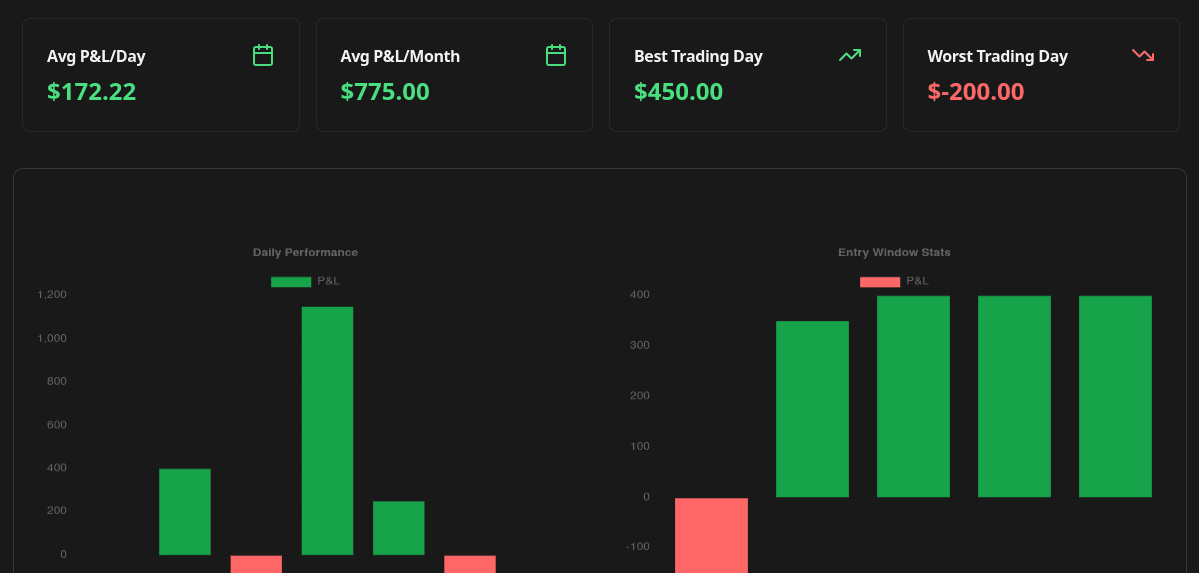
Using analytics in your trade journal offers many benefits. First, it helps with improved performance tracking. You can see how well you are doing over time. This means you can spot trends in your trading. For example, if you notice you perform better on certain days, you can adjust your trading schedule.
Next, analytics help identify strengths and weaknesses. By reviewing your trades, you can see what strategies work best. Maybe you excel at day trading but struggle with long-term investments. Knowing this can guide your future trades.
Enhancing risk management is another key benefit. Analytics allow you to assess how much risk you take on each trade. You can calculate your win-loss ratio and adjust your strategies accordingly. This way, you can protect your capital and avoid big losses.
Finally, analytics support making informed trading decisions. Instead of guessing, you can rely on data. This leads to smarter choices. For instance, if analytics show a particular stock is consistently losing value, you might decide to sell before losing more money.
Tools and Techniques for Analytics
There are many tools available for traders to use analytics. Some popular analytics tools include TradingView, MetaTrader, and Thinkorswim. These platforms offer features that help you analyze your trades easily.
Setting up analytics in your trade journal is simple. Start by recording your trades consistently. Include details like entry and exit points, trade size, and outcomes. Then, use software or spreadsheets to track this data.
Techniques for analyzing trading data vary. You can use charts to visualize your performance. Look for patterns in your trades. For example, if you notice you often lose money on trades made after 3 PM, that's a pattern worth investigating.
Interpreting analytics results is key. Don't just look at numbers; understand what they mean. Ask yourself questions like, "Why did I win this trade?" or "What went wrong here?" This reflection helps you grow as a trader.
Case Studies and Real-Life Examples
Many successful traders use analytics in their trade journals. For instance, a trader named Sarah used analytics to track her performance over a year. She discovered that her best trades happened when she followed a specific strategy. This insight helped her refine her approach and increase her profits.
Lessons learned from analytics in trading are valuable. One common lesson is to avoid emotional trading. Traders who rely on analytics tend to stick to their strategies. They don't let fear or greed influence their decisions.
However, there are common mistakes to avoid with analytics. One mistake is overanalyzing data. Too much focus on numbers can lead to confusion. It's essential to keep things simple and focus on key metrics.
Looking ahead, future trends in trade journal analytics are exciting. More traders are using artificial intelligence to analyze their data. This technology can spot trends faster than humans. As a result, traders can make quicker and smarter decisions.
In summary, analytics are essential for your trade journal. They help you track performance, identify strengths and weaknesses, enhance risk management, and make informed decisions. By using the right tools and techniques, you can improve your trading game. So, start using analytics today and watch your trading skills grow!
Suggested Posts

Complete Guide to Chart Templates and Requirements
A comprehensive guide to all chart templates available in FxJournalStats. Learn what each template does, what metrics it tracks, and which Notion columns are required.
Read more
How to Create and Track Trading Milestones in Your Notion Journal: A Step-by-Step Guide
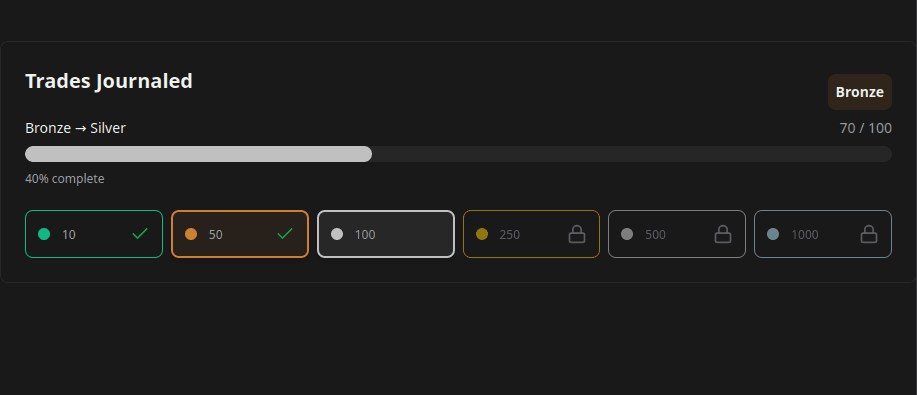
Learn how to create, customize, and embed trading milestones in your Notion journal. Track your achievements with progress bars, badges, and circular displays to celebrate your trading journey.
Read more
A Step-by-Step Guide to Adding a Custom Calendar to Your Notion Journal for Better Tracking
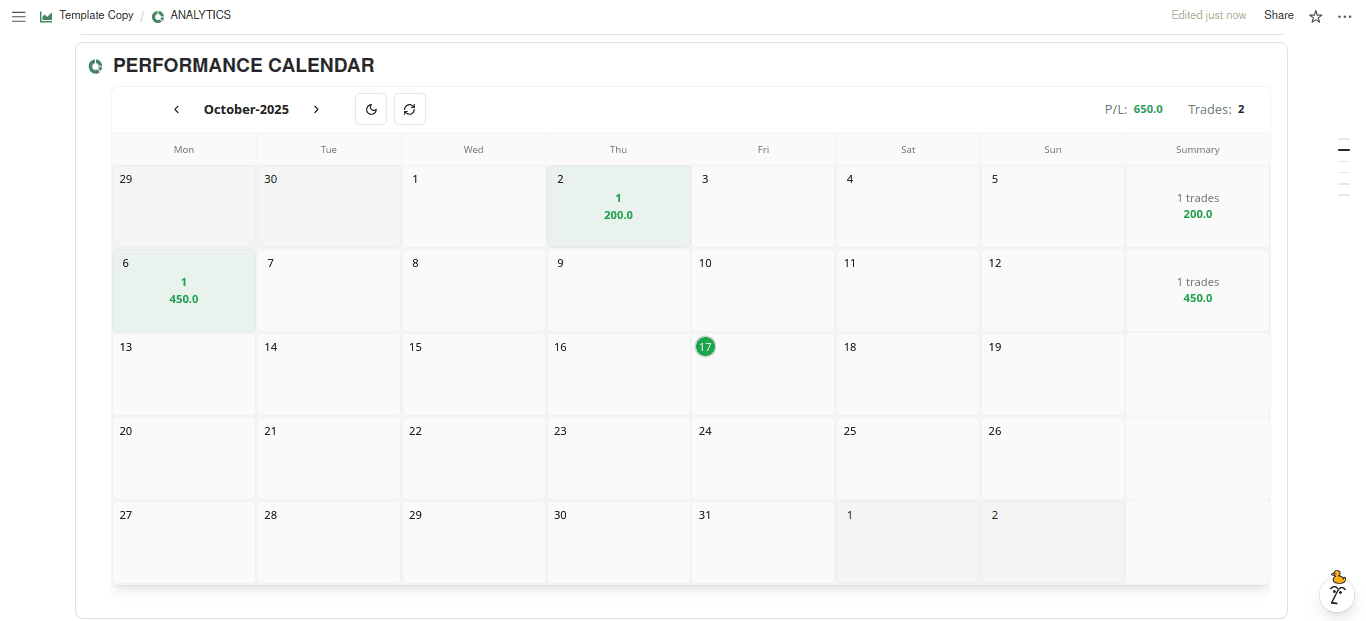
This guide walks you through adding a custom calendar to your Notion journal step-by-step...
Read more