How to Create Custom Charts in Your Notion Journal: A Step-by-Step Guide

Custom charts can elevate your Notion journal, making it an invaluable tool for tracking, visualizing, and analyzing your data. By integrating custom charts with your Notion database, you can identify trends and make informed decisions with ease. This comprehensive guide walks you through the process of creating and embedding custom charts into your Notion journal.

Step 1: Access the Chart Page
If you don't have an account read this guide to setup your account.
Begin by navigating to the Dashboard page in your app.
- Click the Chart tab, which will redirect you to the Chart Page. This is your central hub for managing and creating charts.
- On the Chart Page, select the Notion journal you’ve linked to the app. This journal acts like a folder where your custom charts will be stored and displayed, keeping everything organized and relevant.

Step 2: Add a New Chart
Click the Add Chart button to open a modal form. Fill out the following fields:
- Chart Type: Select from options like bar, line, or area charts.
- Journal: Choose the journal where the chart will be saved.
- Notion Database: Pick the specific database you want to use for your chart data.
Submit the form to proceed to the editor's page.

Step 3: Customize Your Chart
The editor's page has two sections: Settings on the left and a Chart Preview on the right.
Settings Panel
- Chart Type: Change the chart type if needed.
- X-Axis Options: Select fields like date, checkbox, select, or title from your Notion database.
- Y-Axis Options: Choose numerical fields for the y-axis.
- Advanced Options:
- Add a chart name and labels for clarity.
- Enable the "Cumulative" radio button to accumulate y-axis values. When selected, a Starting Value input field appears for setting the initial value.
Chart Preview Panel
As you configure the settings, the chart updates in real time, allowing you to refine it. Once satisfied, click Save. At the top right, an Embed Link will be generated.

Step 4: Embed the Chart in Notion
Copy the embed link and paste it into your Notion database. The chart will now display seamlessly within your journal.

Why Custom Charts in Notion Matter
Creating custom charts allows you to analyze your data visually, track performance trends, and make data-driven decisions. With features like cumulative charts and real-time previews, your Notion journal becomes a powerful analytics tool.
Optimize your workflows today by following this guide and take your Notion journaling to the next level!
Suggested Posts
How to Export Your TradingView Trade Data and Turn It into Actionable Insights
TradingView is a powerful platform for traders, offering advanced charting tools and broker integration. However, analyzing your trading performance requires more than just charts—you need data.
Read more
How to Export MatchTrader Trade Data for Analysis: A Step-by-Step Guide
Analyzing your trading data is a powerful way to identify trends, optimize strategies, and improve performance. MatchTrader makes it simple to export your trade data, and with tools like FxJournalStats, you can transform your data into insightful charts and calendars...
Read more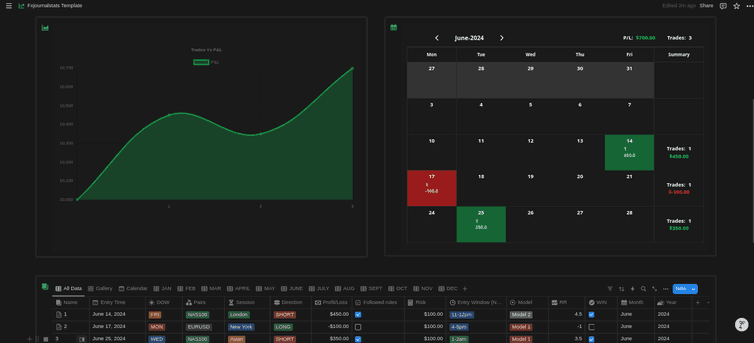
Step-by-Step Guide to Adding Analytics (Charts & Calendars) to Your Notion Journal with FxJournalStats
Learn how to enhance your Notion journal with powerful analytics using FxJournalStats. This guide walks you through creating custom charts and calendars, linking them to your Notion database, and tracking data visually for better insights and productivity.
Read more