How to Setup Analytics (charts, calendar, widgets) using FxJournalStats Notion Journal Template.
Updated: June 16, 2024
Understanding how to visualize and analyze your trading data is crucial for making informed decisions and improving your trading performance. This guide is designed for traders who use Notion to document their trades and want to leverage analytics to gain deeper insights. By the end of this article, you will be equipped with the knowledge to seamlessly integrate analytics into your Notion trade journal and enhance your trading strategy.
Table of Contents
In this article, we will cover the following:
- Step-by-step instructions to set up analytics for your Notion trade journal using fxJournalStats template.
- Tips and tools to enhance your trading insights
Follow this updated guide: guide
Utilizing Charts and Graphs.
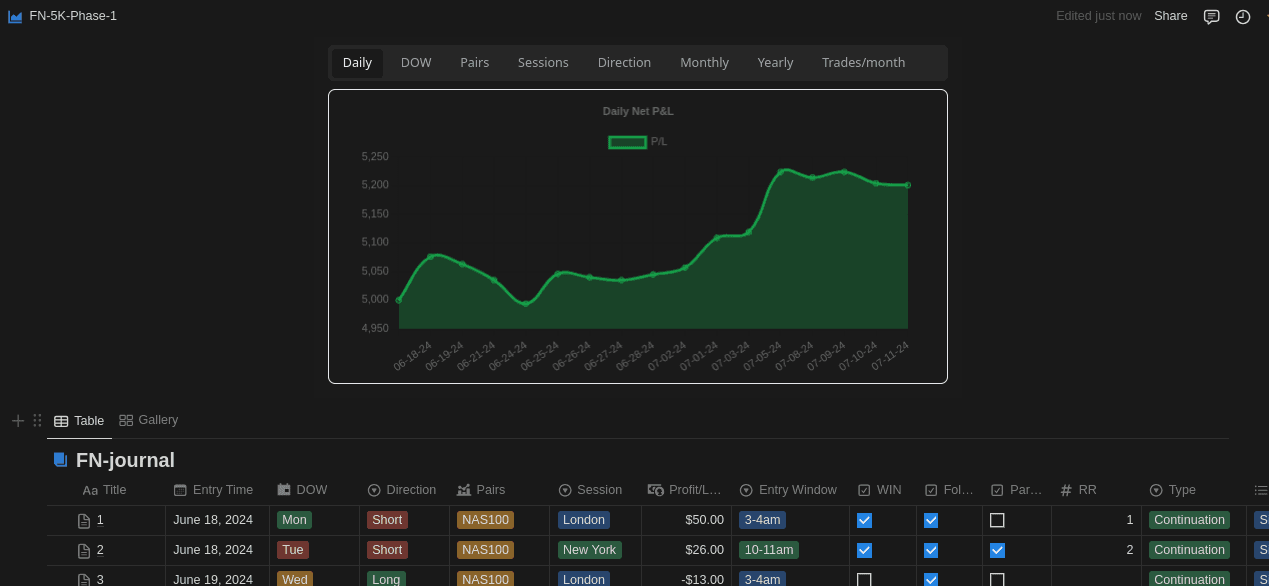
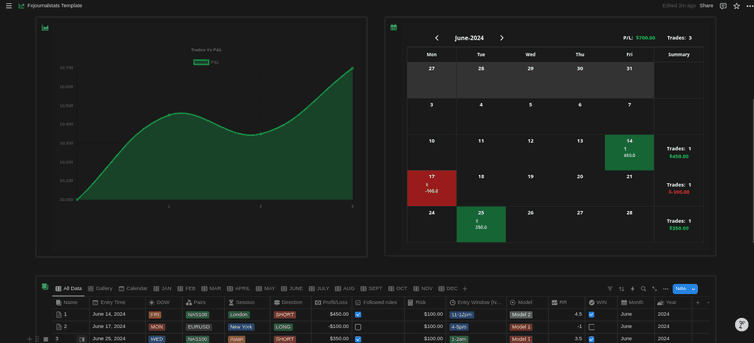
Visualizing your data is essential for quick insights. FxJournalStats offers various charts and graphs that help you understand your trading performance at a glance.
Here's are the stats you will get:
- Trade Count
- Win rate
- Accumulated profit/loss
- Biggest win
- Biggest loss
- Daily net profit/loss
- Day of the Week Average profit/loss
- Pairs Average profit/loss
- Trading Sessions Average profit/loss
- Direction Average profit/loss
- Monthly and Yearly Average profit/loss
- Calendar showing number of trades taken and the net profit/loss for the day.
Conclusion
Integrating analytics with your Notion trade journal can significantly enhance your trading performance. By following the steps outlined in this guide, you can easily set up and visualize your trading data, enabling you to make more informed decisions. Remember, the key takeaway is the power of data in trading; it provides insights that can lead to better strategies and increased profitability.
Suggested Posts
Step-by-Step Guide to Adding Analytics (Charts & Calendars) to Your Notion Journal with FxJournalStats
Learn how to enhance your Notion journal with powerful analytics using FxJournalStats. This guide walks you through creating custom charts and calendars, linking them to your Notion database, and tracking data visually for better insights and productivity.
Read more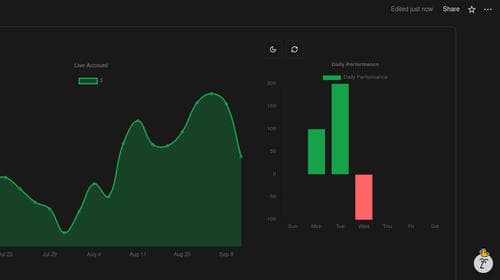
How to Create Custom Charts in Your Notion Journal: A Step-by-Step Guide
Follow this step-by-step guide to create and embed custom charts into your Notion journal...
Read more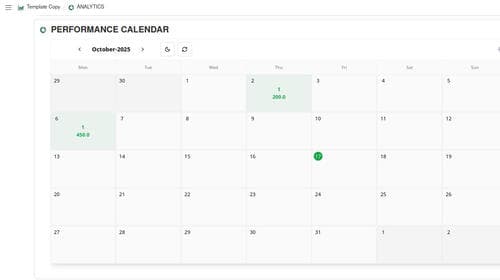
A Step-by-Step Guide to Adding a Custom Calendar to Your Notion Journal for Better Tracking
This guide walks you through adding a custom calendar to your Notion journal step-by-step...
Read more